As mentioned in a previous post, I've been really enjoying the OpenDPS Programmable Power Supply project introduced by Johan . This has been a really cool and fun learning opportunity.
Recently, I was able to get an OpenOCD / GDB session running on Ubuntu to do single-step debugging . If you've ever used gdb on a linux machine, even with the tui ... well, it is really cool, but when coming from the world of Visual Studio, there are a lot of cool IDE features missing.
I've tried Visual Micro and really like that environment. The drawback is that (at least at the time) there was no JTAG debugging. I noticed a recent update mentions that, so I need to revisit. Another drawback is that it is *very* Arduino specific. So embedded apps that use other libraries - say FreeRTOS - are practically impossible to load up, compile, and debug.
Another major player in the Visual Studio IDE world is the SysProgs VisualGDB add-in app. It is a considerably more serious debugger supporting JTAG and more... alas there's *no* current or even planned Arduino library support. I really like the Arduino world. I have several ESP8266 and soon ESP32 projects that use Arduino-style code libraries. Adafruit in particular has a ton of really cool open source ESP8266 libraries and sample code .
Enter VSCode. WOW! It supports gdb debugging! And shockingly easily!
First, make sure you have the VSCode ms-vscode.cpptools add-in installed.
Browse to the source code directory of your embedded app. In my case, I have my "Z:" drive mapped to a VM hosting Ubuntu (I have samba installed there).
net use z: \\192.168.8.130\c$\
It seems to be very important to use the same full path on Windows as Linux, as this process seems to see the full path on the Linux side for debugging, so Windows needs to have the same respective path starting at the root (e.g. in my case /home/gojimmypi/ ).
I keep my projects in a directory called ~/workspace. My OpenDPS project directory is thus:
Z:/home/gojimmypi/workspace/opendps/opendps/
Right click on the directory in Windows File Explorer and click "Open with Code". From VSCode, click on Debug - Add Configuration. Then select "C++ (GDB/LLDB)". A template comes up, ready to be filled in, but perhaps not the most intuitive the first time.
Here's my complete launch.json that you could purge / edit & replace the default template:
I had some initial difficulties as noted in issue 706 on gitthub, so be sure to take note of the forward slashes (not back-slashes!) when editing the file paths.{ "version": "0.2.0", "configurations": [ { "name": "Debug", "type": "cppdbg", "request": "launch", "miDebuggerPath": "C:/workspace/opendps/opendps/arm-none-eabi-gdb.exe", "targetArchitecture": "arm", "program": "Z:/home/gojimmypi/workspace/opendps/opendps/opendps.elf", "setupCommands": [ { "text": "file Z:/home/gojimmypi/workspace/opendps/opendps/opendps.elf" }, { "text": "target remote 192.168.8.130:3333" }, { "text": "monitor reset init" } ], "externalConsole": false, "cwd": "Z:/home/gojimmypi/workspace/opendps/opendps/" } ] }
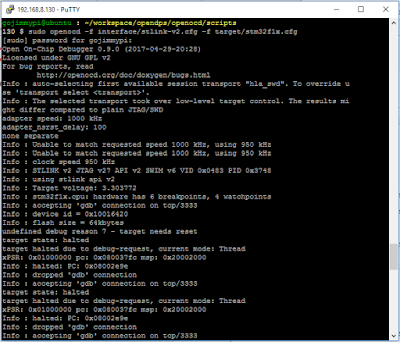
Note that I have OpenOCD running on the Ubuntu VM (192.168.8.130) and I am using an ST-Link V2 JTAG debugger interface, launched in a putty terminal window like this:
  cd ~/workspace/opendps/openocd/scripts
  sudo openocd -f interface/stlink-v2.cfg -f target/stm32f1x.cfg
I have more details on Ubuntu OpenOCD in my prior post here .
Additionally, I also have Atmel Studio 7 installed, and I am using their arm-none-eabi-gdb.exe file located here:
C:/Program Files (x86)/Atmel/Studio/7.0/toolchain/arm/arm-gnu-toolchain/bin/arm-none-eabi-gdb.exe
If you don't have (and don't want) Atmel Studio installed, you could try to install the Windows GNU ARM Embedded Toolchain located here:
https://developer.arm.com/open-source/gnu-toolchain/gnu-rm/downloads
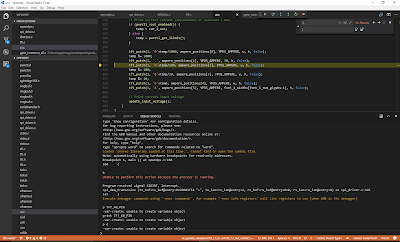
Once everything is step, simply press "F5" to start debugging in VSCode! Some gdb commands result in errors, including important ones like "n" and "s" for stepping. So be sure and use the icons at the top of the screen. You'll probably want to press pause first if there are no break points.
This is simply amazing!
See also: "Configuring launch.json for C/C++ debugging" here:
https://github.com/Microsoft/vscode-cpptools/blob/master/launch.md
Additional resources:
https://code.visualstudio.com/docs/editor/debugging
https://code.visualstudio.com/docs/languages/cpp#_debugging
https://developer.arm.com/open-source/gnu-toolchain/gnu-rm/downloads
https://code.visualstudio.com/docs/editor/tasks
https://github.com/Microsoft/vscode-cpptools/issues/682
Copyright (c) gojimmypi all rights reserved. Blogger Image Move Cleaned: 5/3/2021 1:35:52 PM


